Pivot Table & Charts
A free desktop tool for creating insightful reports
- Summarize
- Analyze
- Report
Compose professional reports with a self-service analytics tool
Easy to start
Highly functional, fast and not as complex as other BI tools! Get started in 3 easy steps:
Install this pivot grid app for any platform: macOS, Windows, or Linux.
Connect to your data: JSON, CSV, OLAP, or Elasticsearch.
Your first pivot is ready!


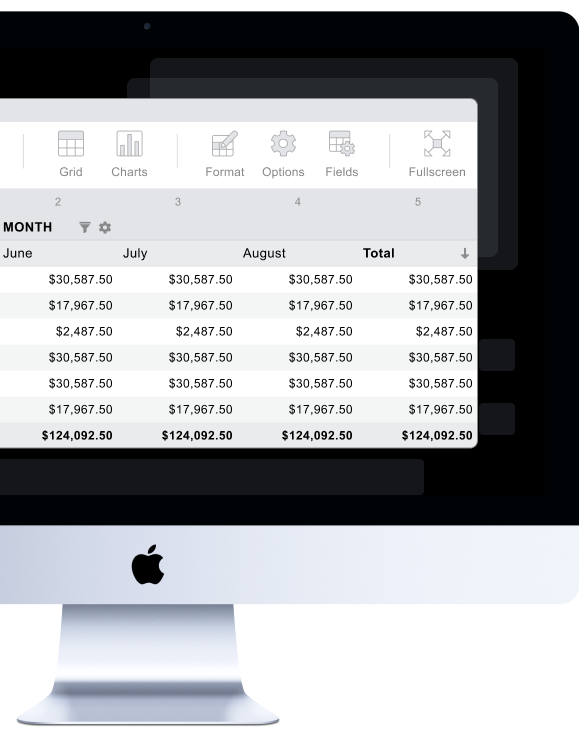
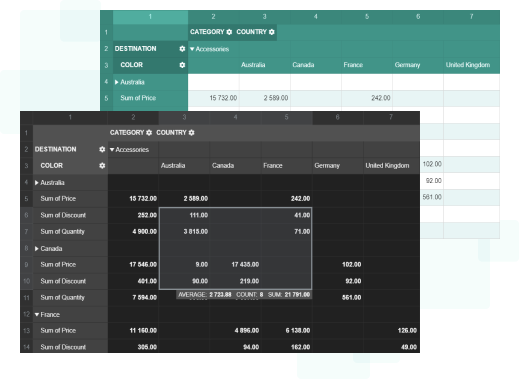
Analyze & explore your data
Use Excel-like features for interactive reporting
Aggregate, group, filter, sort, and drill through your data to spot patterns and catch insights

Use intuitive navigation
Create reports faster with our user-friendly UI
Drag & drop rows and columns, use right-click context menus, and access all the key product functions from the Toolbar — everything is easily accessible.
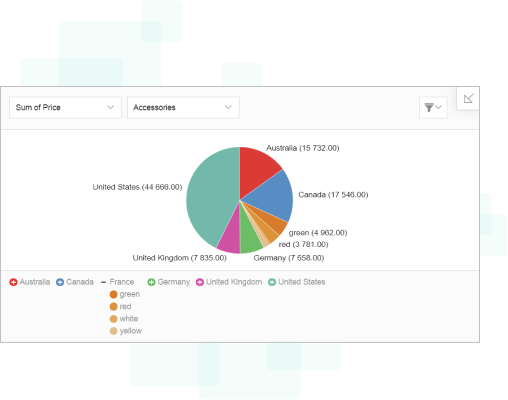
Create Pivot Charts
Visualize your data differently
Switch to built-in pivot charts and give your data a brand-new look.
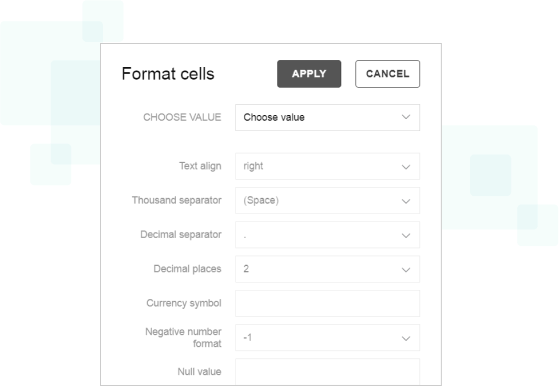
Design your report
Make it fit your needs
Choose one of our 16 themes to customize your report’s look & feel.
Highlight what matters most with conditional and number formatting with your custom logic.
Present the results
Export the results to PDF, CSV, Excel, HTML, or PNG or print it.


you don’t need to be an analyst to look through data and get insights.
No pitfalls, It’s free.
See our licensing terms
Sign up
for Flexmonster releases and updates